Bookings & Reports
Booking Calendar
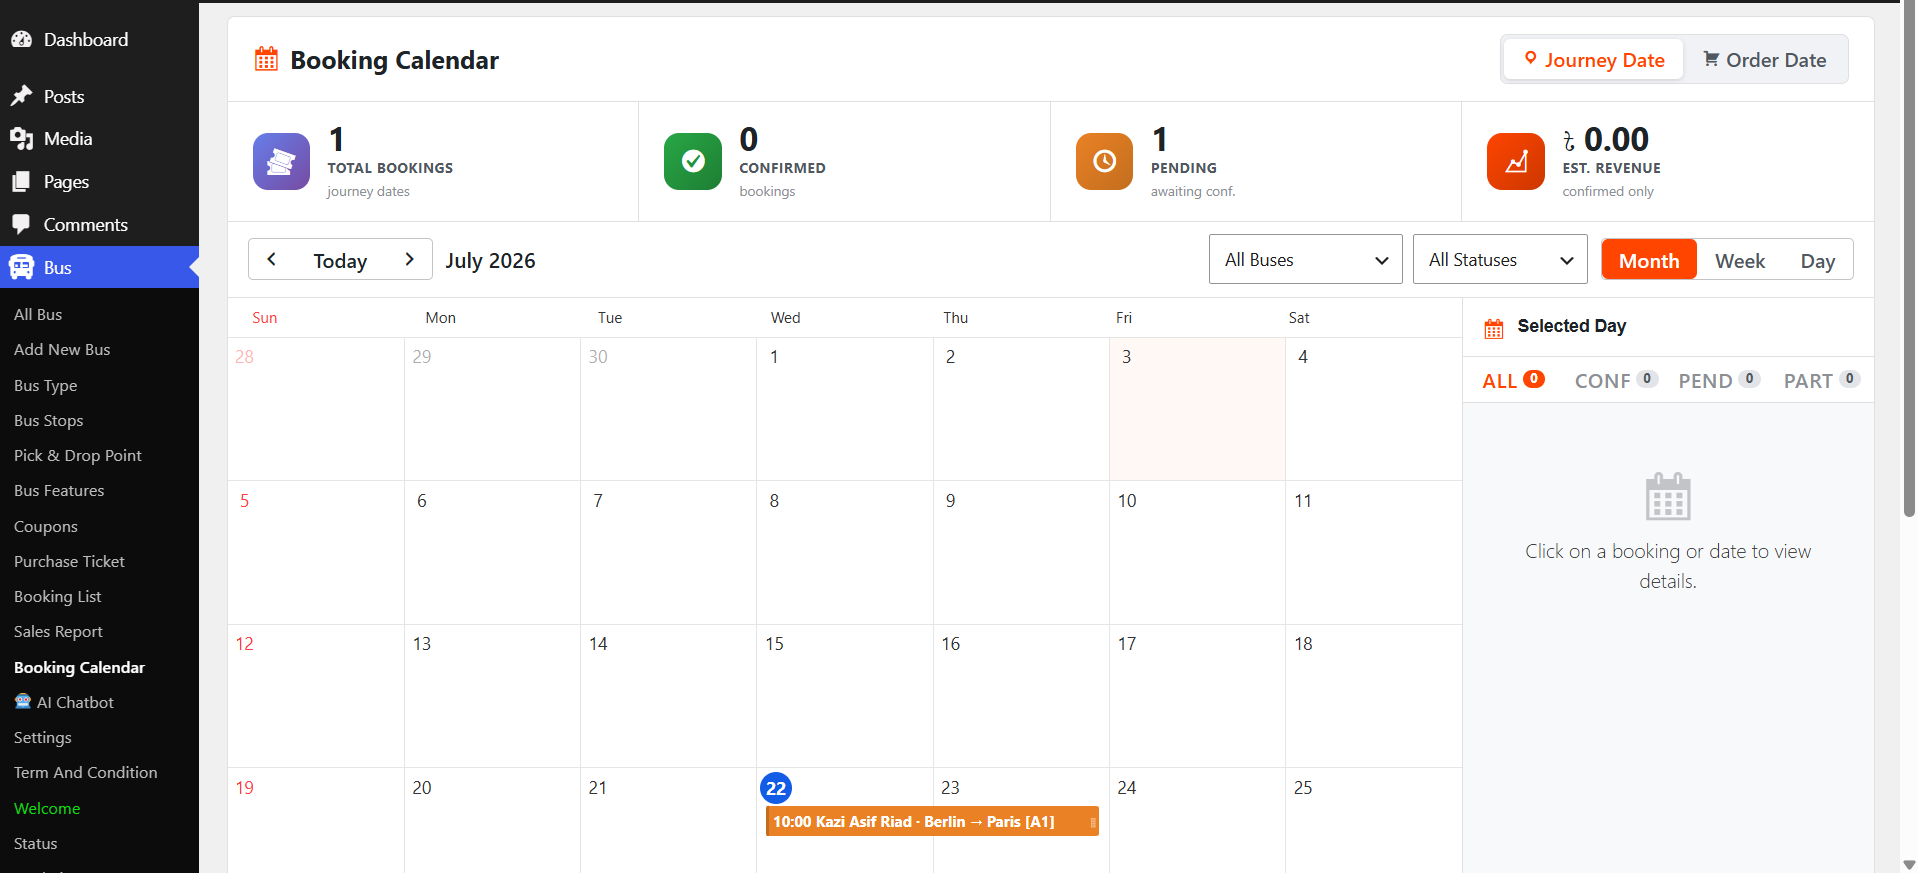
Summary Analytics Cards
- Total Bookings — overall count of journey bookings
- Confirmed — how many bookings have been successfully confirmed
- Pending — reservations currently awaiting confirmation
- Est. Revenue — estimated total revenue derived exclusively from confirmed bookings
View Switcher & Filters Toolbar
- Date Navigation — Today button and arrow controls to navigate through time
- Filter Dropdowns — All Buses, All Statuses
- View Mode Tabs — Month, Week, Day
- Display Toggle Buttons — switch between Journey Date and Order Date views
Interactive Calendar Grid & Selected Day Panel
- Calendar Grid — days of the week containing scheduled trips (e.g. an active booking item showing time, passenger name, and route)
- Selected Day Sidebar — detailed metrics for a chosen day (ALL, CONF, PEND, PART counts) with instructions to click a booking or date to view details
Admin Notification Center
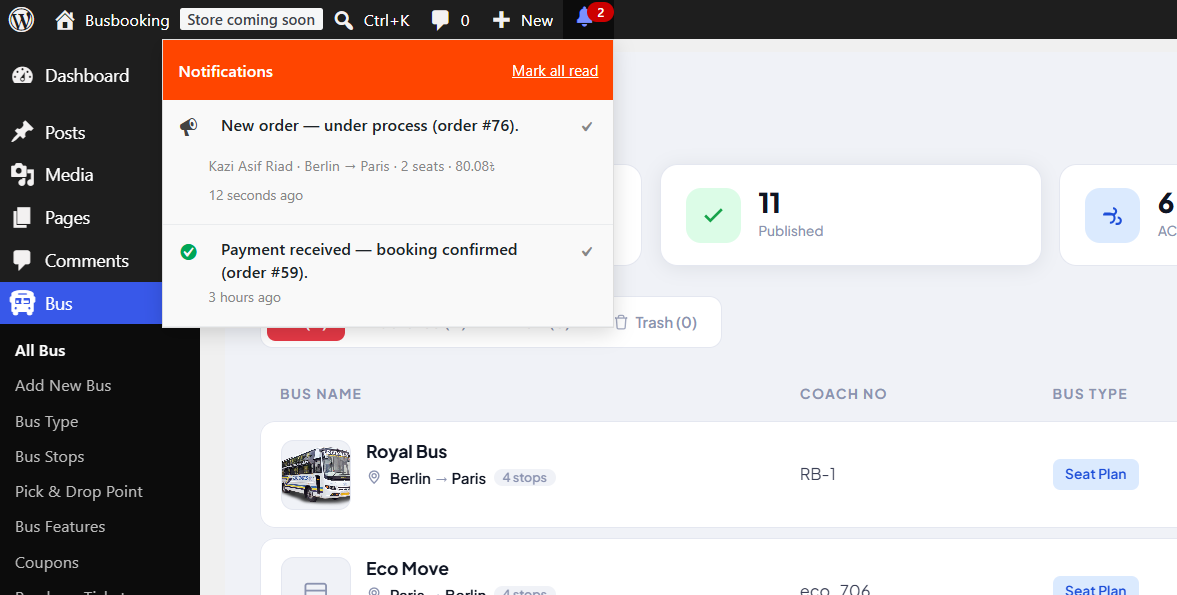
The Admin Notification Center provides administrators with real-time alerts regarding new orders, reservations, and payment statuses directly within the WordPress dashboard.
- Notification Badge — displays an active alert count (e.g. 2 unread notifications) in the top WordPress admin bar
- Dropdown Center — clicking the notification bell opens a floating panel detailing recent system events and booking updates
Booking List
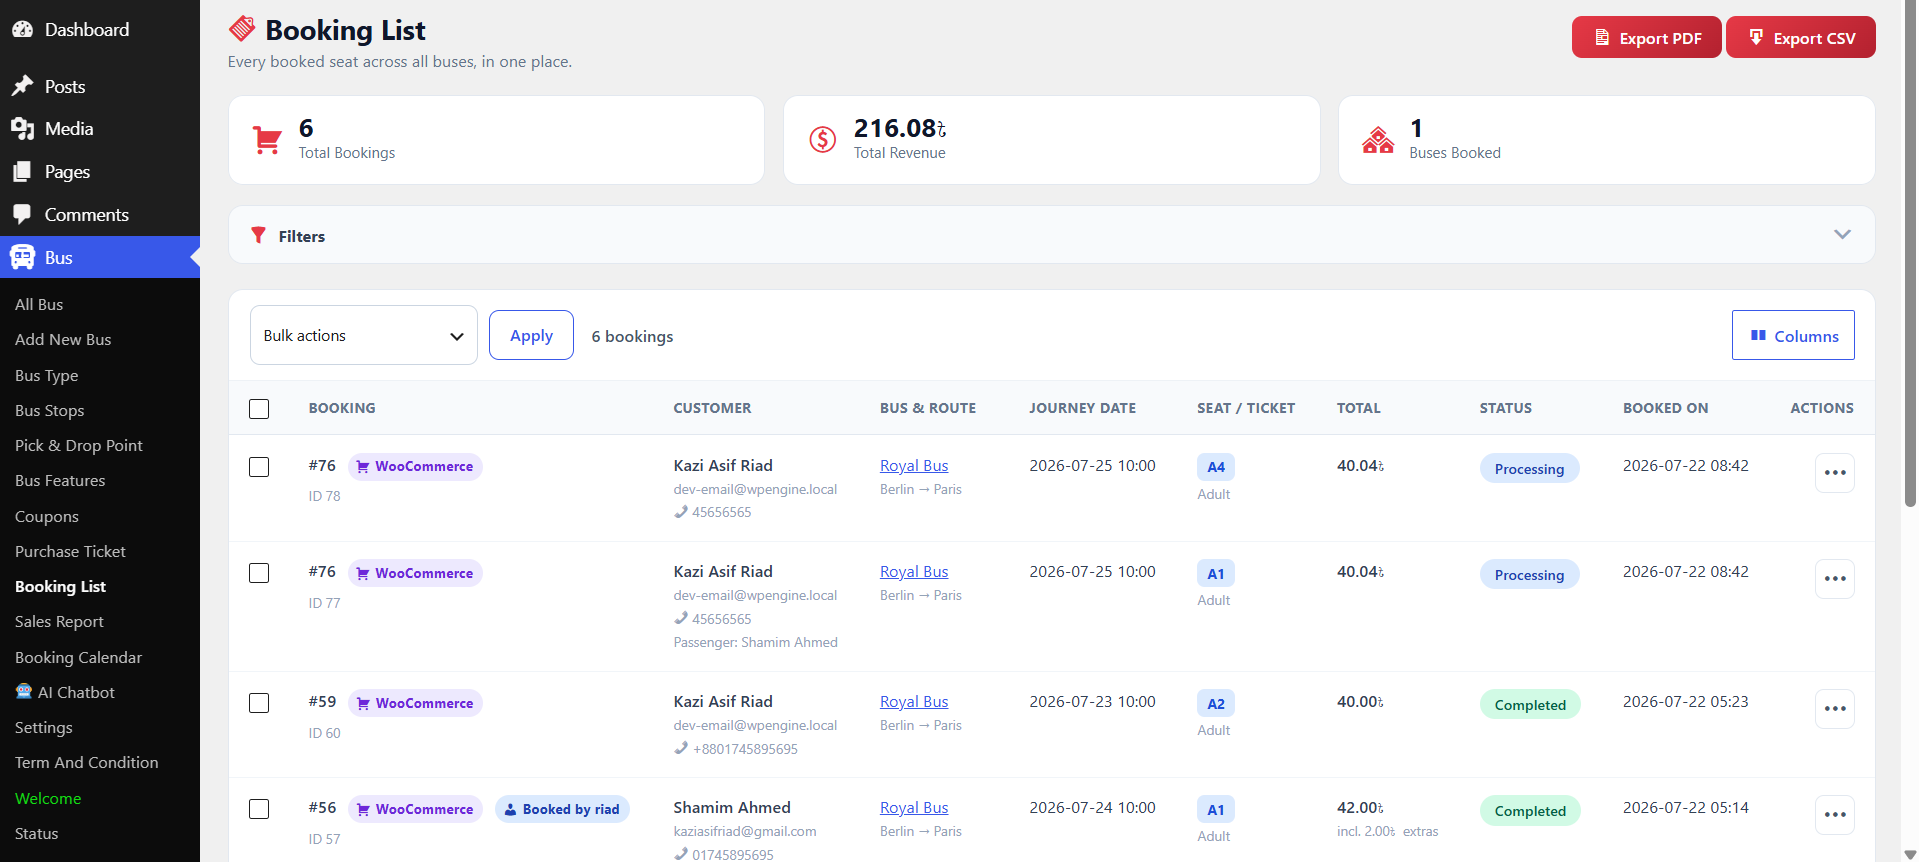
The Booking List screen serves as the master reservation dashboard, compiling every booked seat across your entire fleet into a single management view.
Summary Analytics Cards
- Total Bookings — total number of individual seat reservations
- Total Revenue — cumulative financial intake across all bookings
- Buses Booked — count of unique vehicles with active reservations
Filters & Bulk Operations Bar
- Filters Dropdown — an expandable accordion to refine booking lists by criteria
- Bulk Actions — batch operations (e.g. status updates or deletions) with an Apply button
- Entry Counter & Columns Tool — total booking count in view, plus a Columns toggle to customize visible table data
Booking Data Table
| Column | Description |
|---|---|
| Booking | Order and ID reference, plus payment gateway integration (e.g. WooCommerce) |
| Customer | Buyer's name, email, phone, and passenger metadata |
| Bus & Route | Vehicle and itinerary (e.g. Royal Bus, Berlin → Paris) |
| Journey Date | Scheduled departure date and time |
| Seat / Ticket | Assigned seat number and passenger type |
| Total | Itemized cost for the individual ticket or seat |
| Status | Live fulfillment state (e.g. Processing, Completed) |
| Booked On | Exact timestamp when the reservation was created |
| Actions | Row-level options menu to manage individual booking entries |
Sales Report
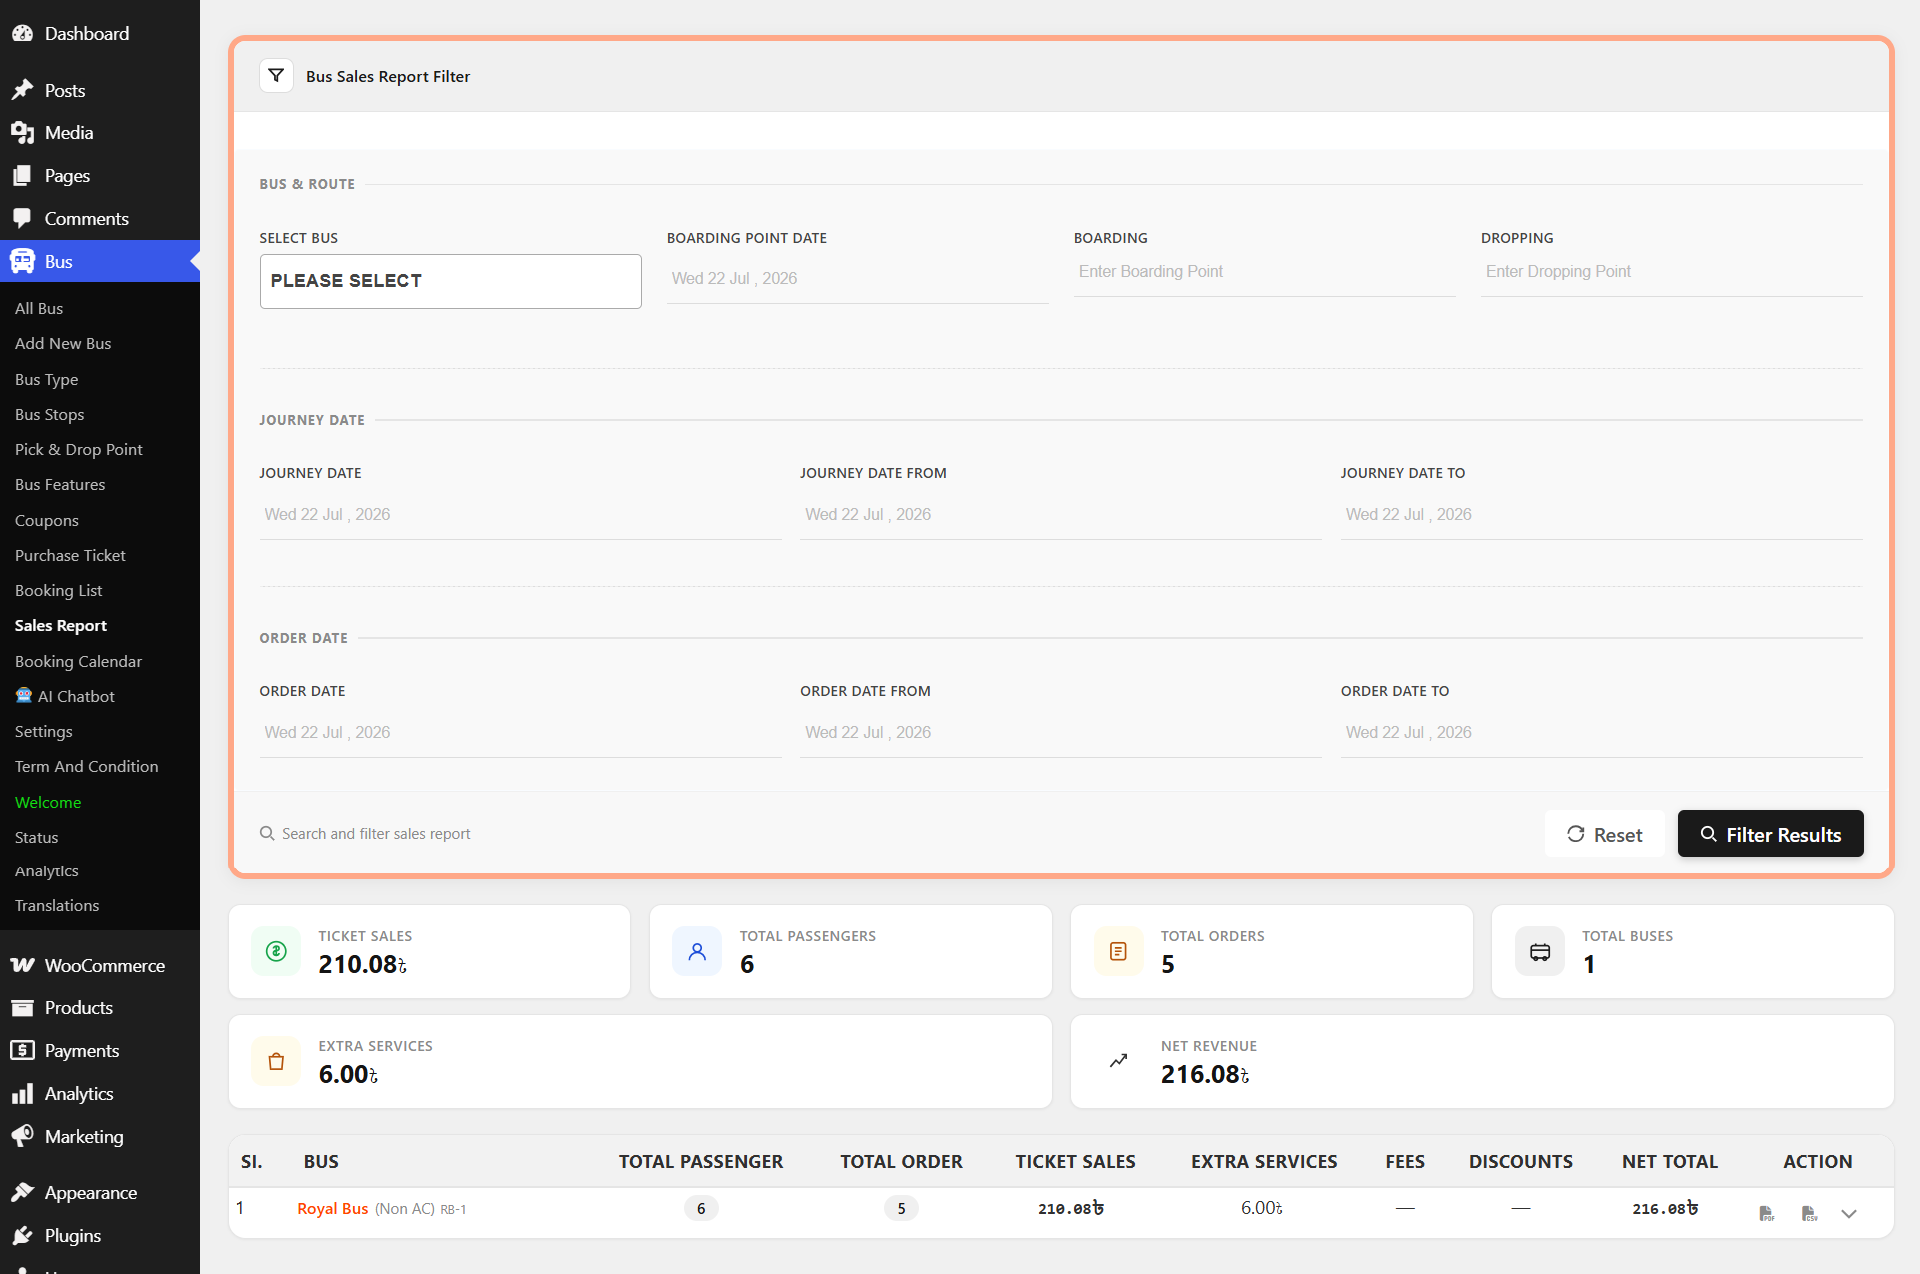
The Sales Report screen provides an advanced analytics and financial tracking dashboard to monitor ticket sales, passenger volumes, extra service revenues, and net totals.
Filter Section
- Bus & Route Filters — Select Bus, Boarding Point Date, Boarding / Dropping station inputs
- Journey Date Filters — Journey Date From / To
- Order Date Filters — Order Date From / To
- Search & Action Controls — Search Input, Reset, and Filter Results
Summary Analytics Cards
- Ticket Sales — total revenue generated specifically from ticket fares
- Total Passengers — overall volume of travelers registered
- Total Orders — total number of transactions processed
- Total Buses — number of active vehicles contributing to the report
- Extra Services — additional revenue generated from onboard add-ons
- Net Revenue — total combined financial intake after accounting for sales and extras
Sales Report Data Table
| Column | Description |
|---|---|
| SI / Bus | Index and associated bus profile with category and number |
| Total Passenger & Total Order | Passenger counts and order volumes per vehicle |
| Ticket Sales | Revenue from ticket fares for that vehicle |
| Extra Services | Revenue from onboard add-ons |
| Fees / Discounts | Applied fees or discounts (— when none) |
| Net Total | Final calculated revenue for the entry |
| Action | Export (PDF, CSV) and management options |